

Why Small Nonprofits Hold the Key to Philanthropy’s Renewal
The newest Bank of America Study of Philanthropy made headlines for record generosity: affluent households gave an average of $33,219, with an 81 % participation rate.
But hidden in the data is the story that matters: Nine years ago, participation was 91 %.
We haven’t lost generosity.
We’ve lost connection.
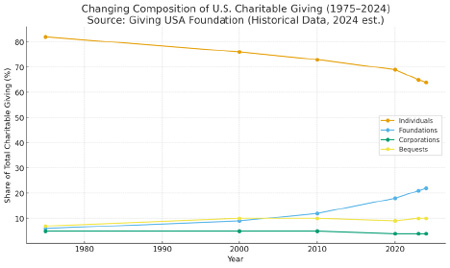
Here’s the visual timeline showing how individual giving (orange line) has steadily declined, from about 82% in 1975 to 64% in 2024, while foundations (blue) and DAFs have risen sharply, marking a structural shift from personal to institutional generosity.
Across the sector, the Fundraising Effectiveness Project tells a similar story:
- Overall donor retention: 42.9% (−2.6 pts YoY)
- First-time donor retention: 19.4% (4 of 5 never return)
Meanwhile, the 2025 GIVING USA Report confirms that generosity itself is not dead — Americans still gave more than $592.5 billion in the past year. But giving patterns are shifting: total giving rose modestly (about 3.3% after inflation), even as the number of givers keeps falling.
Two decades ago, nearly two-thirds (≈ 65%) of U.S. households gave annually. Today, fewer than half (≈ 45%) do.
Generosity isn’t disappearing — it’s concentrating. Fewer people are carrying more of the giving load.
In other words, people aren’t giving less because they care less; they’re giving differently — to fewer organizations that feel personally meaningful.
The Bank of America and GIVING USA findings converge on the same truth: this isn’t a wealth problem — it’s a relationship problem. And while large institutions feel the tremors, small nonprofits stand on the fault line.
Generosity isn’t disappearing — it’s concentrating. Fewer people are carrying more of the giving load.
Most Nonprofits Run on Heart — and Hurt
Behind every inspiring story of generosity lies a fragile reality:
- 85% of U.S. nonprofits are volunteer-run
- 82% operate on under $250K a year
- 70% have budgets below $100K
- 60% survive on less than $50K (National Council of Nonprofits & IRS Exempt Statistics, 2024)
- 30% close within 10 years
That’s not scale — that’s survival. These organizations are powered by compassion yet paralyzed by exhaustion. They’re losing donors and, quietly, losing the capacity to breathe.
The Burnout Crisis: Fragmented Systems, Fractured Relationships
Burnout has become the silent pandemic of the purpose sector — the shadow that follows every “do more with less.”
In large nonprofits, silos are the culprit: fundraising, programs, marketing, and finance chase disconnected KPIs. Efficiency becomes fragmentation; collaboration turns into competition. Relationships suffer internally before they ever suffer externally.
In small nonprofits, fragmentation looks different but feels the same. Volunteers and founders wear ten hats — fundraising, accounting, communications, compliance — burning the candle at both ends. There’s no margin left for reflection or relationship.
Both models break for the same reason: we mistake activity for impact.
Burnout doesn’t just drain energy — it dissolves connection. And connection, not capacity, is the true predictor of sustainable human relationships.
Without space to pause and connect, giving becomes transactional, storytelling performative, and donors disengage.
This is the deeper crisis beneath the participation decline — a crisis of belonging.
The Spreadsheet Trap
Small nonprofits often start in the spreadsheet world — managing donations, volunteers, and budgets in endless rows and columns.
At first, it works. Then the files multiply: “final,” “final_v2,” “final_corrected.” Donor names duplicate. Receipts vanish.
Trying to stay “lean,” many avoid adopting real tools, assuming technology is expensive or complex. Ironically, that fear of spending becomes a mechanism of waste.
Research from NTEN shows that struggling nonprofits use nine times less technology than leading ones — a gap that directly affects trust, efficiency, and mission effectiveness.
The spreadsheet world feels free — but it quietly costs the most: in time, in errors, and in lost relationships.
Burnout doesn't just drain energy — it dissolves connection

A Physician’s Instinct: Giving Is a Behavior
When I helped launch GOSUMEC Foundation USA, I didn’t approach it as a fundraiser. I approached it as a physician — and later, as a researcher.
What began as our foundation’s survival strategy evolved into The GIVE Study, a 12-month prospective research project examining how zero-staff nonprofits can build sustainable giving through behavioral design.
In medicine, we learn early that health isn’t a single event — it’s a system of behaviors sustained over time. You can prescribe the perfect treatment, but without rhythm, feedback, and continuity, outcomes falter.
Giving works the same way.
Philanthropy, at its core, is not a financial system — it’s a behavioral one. Donor trust, like patient trust, is built on consistent signals of safety, empathy, and responsiveness. When those signals break — when follow-ups don’t happen, gratitude feels mechanical, or communication becomes sporadic — relationships weaken.
As a clinician, I was trained to look for patterns, not episodes. I realized most nonprofits live in emergency-room mode — constantly reacting to crises, scrambling for funds, and operating on short-term fixes.
What they need instead is a chronic-care model for generosity: structured, preventive, and relationship-based.
That mindset became our foundation’s operating philosophy.
Einstein once said, “Everything should be made as simple as possible, but not simpler.” That became our guiding rule.
Our goal wasn’t to digitize charity. It was to design simplicity that could sustain generosity.
Just as an effective medical system automates lab results, scheduling, and reminders so physicians can focus on people, our nonprofit automates receipts, reports, and acknowledgments — so we can focus on relationships.
When systems handle the repetitive, humans can handle the relational.
That is the essence of behavioral philanthropy — where giving, like healing, is guided not by urgency, but by rhythm, trust, and care.
From Fear to Flow: Discovering Givebutter
We began with zero staff, no consultants, and free tools: Givebutter, Canva, Zoom, Opus Clip, Google Workspace.
We realized small nonprofits don’t fail because tools are expensive; they fail because their tools are fragmented.
The average nonprofit juggles three to five systems beyond its CRM. We built one cohesive rhythm instead — powered by Givebutter Plus.
Our entire tech stack still costs under $10K per year, fully funded by our board to keep donor dollars at 100% impact.
Typical vs Simplified System
| Category | Typical Small Nonprofit | GOSUMEC Model |
|---|---|---|
| Donation Platform | PayPal / Stripe (+ fees) | Givebutter Plus – $960 |
| Email Marketing | Mailchimp (~ $350 / yr) | Integrated in Givebutter |
| CRM / Database | Excel / Sheets | Givebutter CRM + Tags + Automation |
| Design Tools | Canva Free | Canva Pro – $180 |
| Video Editing | Outsourced / None | Opus Clip – $228 |
| Storytelling | Ad-hoc posts | MemoryFox – $1,800 |
| Collaboration | Email chains | Google Workspace – $0 |
| Website + Hosting | $600 – $2,000 | $2,400 |
| Accounting + Compliance | $1,500 – $3,000 | $1,500 – $3,000 |
| Zoom / Meetings | $120 | $120 |
| Total Annual Cost | ≈ $6–8K (fragmented) | ≈ $9.5K (integrated) |
Most small nonprofits already spend a comparable amount — just not efficiently. Fragmentation drains hours that could go to donors, stories, and community.
The ROI of Simplicity
By moving from spreadsheets to systems, we gained what most lose: time.
Our integrated stack saves ≈ 185 hours per month — the equivalent of two full-time employees. At $45–$50/hour for operations work, that’s roughly $200,000 in staff value saved annually.
Those hours now go to gratitude, storytelling, and community building — the true drivers of trust.
The results speak for themselves: GOSUMEC Foundation USA raised nearly $700K in 2024 and crossed $1 million in 2025 with a tech stack under $10K and zero paid staff.
Efficiency isn’t about doing more — it’s about doing less, better.
Tech as the Brainstem
At GOSUMEC, technology isn’t an add-on; it’s our brainstem — the rhythm that keeps everything alive.
- Givebutter Plus: heartbeat of giving, pledge tracking, automated tasks & QuickBooks sync
- Google Workspace: organizational memory
- Canva + Opus Clip: creative cortex
- MemoryFox: authentic voice
- Accountants + Compliance: steady reflexes
With this rhythm, a zero-staff foundation functions like a team of ten, with none on payroll.
Efficiency That Enables Empathy
Because the system runs itself, we have time to connect.
- > 90% recurring donor retention (vs 77–78% sector average)
- > 70% recurring donor share (vs < 10%)
- Zero overhead (costs funded internally)
Efficiency creates space for empathy — time to thank, listen, and build relationships.
The Recurring Giving Revolution
While overall giving declines, recurring donors defy gravity:
- Monthly giving ↑ 5% in 2024 → 31% of online revenue
- Recurring donors ↑ 127% (2018–2022)
- Average recurring donor gives $949 and stays 8 years (vs 1.7 for non-recurring)
- Retention 77% (vs 34% for one-time donors)
Recurring giving isn’t a payment plan — it’s a trust plan.
The GIVE Study: When Systems Meet Science
Our model evolved into The GIVE Study, a 12-month prospective research project on recurring giving and behavioral design for zero-staff nonprofits.
We call it Neuro-Philanthropy:
Neuro-Philanthropy is the study and practice of how human neurochemistry — particularly dopamine and oxytocin — shapes giving behaviors, transforming generosity from a transactional impulse into a sustained emotional bond.
- Dopamine fuels “I gave.”
- Oxytocin sustains “I belong.”
Most organizations chase dopamine. We built an oxytocin ecosystem — steady, relational, sustainable.
Automation handles transactions; humans handle gratitude and story.
Dopamine fuels 'I gave.' Oxytocin sustains 'I belong.'
A Blueprint for the 92 Percent
(small nonprofits operating under $1M)
Every small nonprofit can replicate this approach:
- Start free – Givebutter, Google Workspace, Canva, Zoom.
- Upgrade intentionally – only when simplicity saves time.
- Automate repetition – let systems handle what humans shouldn’t.
- Integrate, don’t accumulate. Connected tools build capacity.
- Fund tech internally – keep donor dollars 100% impact.
Redirect the $6–10K already spent on fragments into coherence — and watch transformation follow.
From Crisis to Connection
This is not a story about donors leaving; it’s a story about systems failing — and how to rebuild them around belonging.
The participation crisis reveals a sector losing trust at both ends — among the wealthy and the grassroots.
The solution isn’t larger campaigns; it’s smarter systems and stronger relationships.
If we reduce operational chaos, we reduce burnout. If we reduce burnout, we rebuild trust.
Because burnout and belonging are opposites: one empties, the other sustains.
Technology doesn’t replace humanity. It amplifies it. It gives back the hours that spreadsheets steal and turns them into belonging.
That’s how zero staff can build infinite connection.
Start with Tech. Stay with Trust.
References/Citations (Tabular)
APA 7th Edition Reference List
# | Metric | Best Current Source | Source Figure |
1 | Affluent household participation | 2025 Bank of America Study of Philanthropy (Bank of America Private Bank) | 81% of affluent households gave in 2024; down from 91% in 2015 |
2 | Affluent average annual giving | 2025 Bank of America Study of Philanthropy (Bank of America Private Bank) | Average donation ≈ $33,219–$33,291 in 2024 |
3 | Household giving participation (all households) | Indiana University Lilly Family School – Philanthropy Panel Study (PPS) (Lilly Family School of Philanthropy) | 66.2% of households gave in 2000; 49.6% gave in 2018 |
4 | Total charitable giving (2024) | Giving USA 2025 release (Giving USA) | $592.5B in 2024; +6.3% nominal; +3.3% after inflation |
5 | Share of giving by individuals (2024) | Giving USA 2025 coverage (AP) (AP News) | Individuals contributed about 66% of total giving in 2024 |
6 | Donor retention (overall) | FEP Q4 2024 data, summarized by Neon One (publications.fepreports.org) | Overall donor retention 42.9%, a 2.6-point YoY decline |
7 | First-time donor retention | FEP Q4 2024 via Neon One (4aGoodCause) | New donor retention 19.4% |
8 | Monthly giving share of online revenue (2024) | M+R Benchmarks 2025 (2024 data) (M+R Benchmarks 2025) | Monthly giving = 31% of all online revenue; monthly giving revenue grew 5% |
9 | Total online revenue trend | M+R Benchmarks 2025 (M+R Benchmarks 2025) | Online revenue grew 2% overall; monthly giving rose 5% |
10 | Recurring giving impact (value & duration) | Neon One / Givebutter recurring giving summaries (Neon One) | Avg recurring donor ≈ $940–$949/year; typical duration ≈ 8 years |
11 | Recurring vs one-time retention | Givebutter / Giving USA recurring giving explainer (Givebutter) | Recurring donor retention ≈77%; one-time donor retention ≈34% |
12 | Growth in recurring giving | Givebutter citing The Recurring Giving Report (Givebutter) | Recurring giving grew 127% (multi-year period analyzed) |
13 | Very small nonprofits by budget | National Council of Nonprofits + Candid analysis (National Council of Nonprofits) | ≈59% of nonprofits under $50K; ≈97% under $5M; “very small” (under $50K) ≈ 60% of orgs |
14 | Tech usage gap (“9× less tech”) | NTEN’s 2024 Nonprofit Digital Investments report (communityforce.com) | Leading orgs use ~9× more technology tools than struggling orgs |
15 | Inflation-adjusted growth in giving | Giving USA 2025 analysis (BWF) | Real growth ≈3.3% in 2024 giving |
16 | Generosity vs participation (household level) | Lilly School PPS + secondary summaries (Lilly Family School of Philanthropy) | Household giving declined from 66.2% in 2000 to 49.6% in 2018 |
In-Text Citations
- Decline in household giving: (Indiana University Lilly Family School of Philanthropy, 2019; Giving USA Foundation & Lilly Family School of Philanthropy, 2024)
- Affluent-household participation and average giving: (Bank of America Private Bank & Lilly Family School of Philanthropy, 2025)
- Donor-retention figures: (Fundraising Effectiveness Project, 2025)
- Nonprofit size and closure statistics: (National Council of Nonprofits, 2024)


This article really stood out to me. It clearly shows that the problem isn’t lack of generosity, but lack of connection and belonging. I especially liked the focus on small nonprofits and how simple, integrated systems can reduce burnout and strengthen donor relationships. A powerful reminder that trust and meaning matter more than money.
I love your take on how “efficiency isn’t about doing more – it’s about doing less, better.” Your note that “efficiency creates space for empathy” provides a beautiful invitation to consider how we can design systems to better serve us, so we can better serve others.
Thank you for sharing! It’s a joy to see how you’re using Givebutter and other tools as “the rhythm that keeps everything alive”. GOSUMEC Foundation USA is doing a phenomenal job designing efficient systems to free up more time to build and serve your community! 💛